Year End Review for the U.S.
The new normal and
what’s next in 2023
Written by: Matt Lee
Share This Story:
Table of Contents
As 2022 comes to an end and the holidays quickly approach, the L&B LAB looks back on how our industry performed this past year and where our forecasters see it heading as we enter the new year.
2022 in Review – Beginnings of Our New Normal
March through October 2022 saw a resemblance of “normal” volumes of travelers at U.S. airports. While Thanksgiving travel in 2022 fell slightly short of Thanksgiving 2019, it was greater than in 2021, giving our industry a boost in confidence. The pandemic that induced the collapse of travel is now becoming a memory. Trends we saw leading up to 2019 have reestablished themselves, either delayed by a couple of years or accelerated due to pandemic-induced lifestyle changes.
A Country-Wide Snapshot
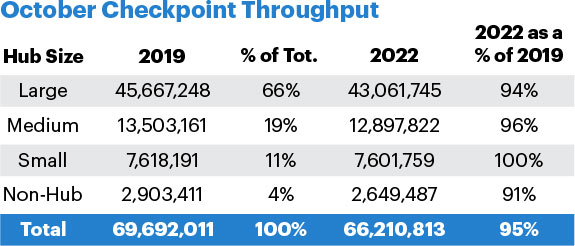
As of the end of October 2022, year-to-date travel through TSA checkpoints was 95% relative to 20191. Travel volumes reached 100% of 2019 from airports classified by the FAA as “small-hub” largely thanks to a leisure-led recovery. Demand at “large-hub” airports was dampened by a relative lack of trans-Pacific air travel due to ongoing COVID travel restrictions in major markets like China, Hong Kong and Japan. Travel at “non-hub” airports was limited by a lack of air service and better flight options from nearby larger airports. Since the recent relaxation of border restrictions by Hong Kong and Japan, the impact of the ongoing COVID policies in China is being observed globally wherever there was significant mobility into and out of China pre-COVID.
Table 1 – YTD October 2019 and 2022 Total TSA Checkpoint Throughput
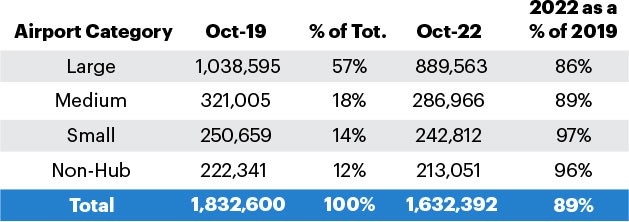
Year-to-date commercial aircraft operations (FAA categories “Air Carrier” and “Air Taxi”) at airports showed a slightly different pattern than passenger travel. Airlines are operating 89% of the flights they operated in 2019. While the recovery in operations at small-hub airports was stronger, the recovery of operations at non-hub airports was almost as strong. Aircraft activity losses at the large-hub airports were driven either by losses of trans-Pacific international service or losses of service by 50-seat aircraft to primarily small-hub and non-hub destinations – both of which are discussed further in the following sections.
Table 2 – YTD October 2019 and 2022 Total Air Carrier and Air Taxi Aircraft Operations
Pilot Shortages at Regional Carriers Shaped Air Service
The shortage of air-transport-rated pilots started well before the pandemic when the FAA increased the number of flying hours required to receive an air transport rating from 200 to 1,500 hours. In early 2020, airlines accelerated the voluntary retirement of pilots aged between 60 and 65 and reduced pilot training activities as an early response to the lack of flying during the early phases of the pandemic. As air travel has rebounded, the reduced number of new pilots in training combined with the early retirements has exacerbated the ongoing shortage of air-transport-rated pilots.
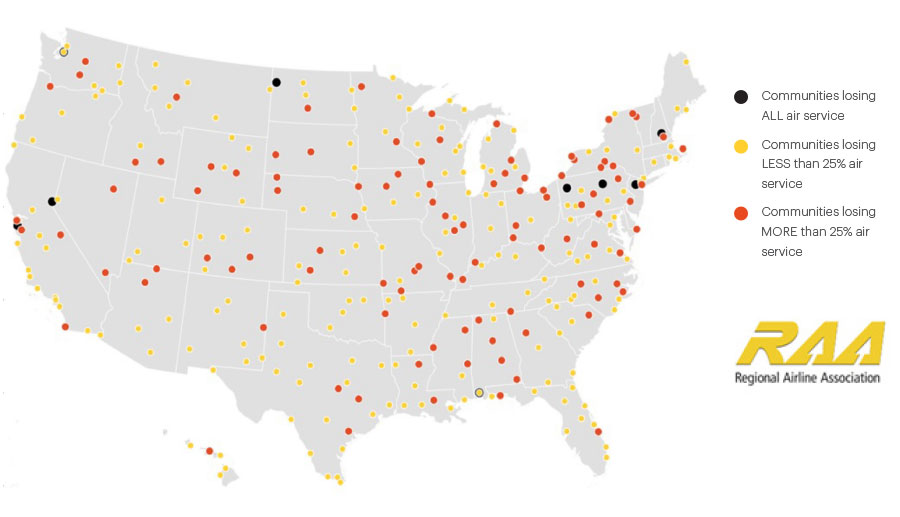
As a result, airlines have had to reshape their networks to maximize the number of seats they could fly with the pilots they had on hand. As shown below, 324 (76%) airports lost some air service. The Regional Airlines Association (RAA) states that 14 airports lost all air service, while 161 airports lost at least a quarter of their flights. Most of these airports that lost at least a quarter of their flights were small and non-hub airports.
Figure 1 – 324 Airports Lost Air Service
Airlines have reshaped their networks in two ways. First, they have reduced the number of hubs where they run small-hub and non-hub flights. For example, American Airlines used to fly from Charleston, West Virginia (CRW) to Charlotte (CLT), Philadelphia (PHL) and Washington Reagan-National (DCA). In 2022, American Airlines dropped Philadelphia as a destination from Charleston. Second, they consolidated flights from two nearby airports. For example, Delta Air Lines consolidated their Cleveland Region flights into Cleveland Hopkins Airport (CLE), suspending their service indefinitely at Akron-Canton Airport (CAK), which is a 60-minute drive away. Of the 14 airports that lost all airline service, most had air service available from an airport within a one-hour drive.
Airlines reduced their flights by reducing or eliminating the number of the smallest aircraft in their fleets. United and Delta grounded all their 50-seat aircraft, while American chose to keep some of these aircraft in the fleet and has announced plans to bring back more. Over 500 of the 50-seat aircraft remain grounded.
Substantial Differences in Travel Recovery by Region
The recovery of air travel demand has been uneven across the FAA Administrative Regions. Travel now exceeds 2019 in the Alaskan, Southwest and Southern Regions, while travel demand in the Great Lakes and Eastern Regions is 12% and 10% lower respectively than in 2019. These differences in travel recovery may be attributed to the Eastern and Great Lakes Regions having older populations than other regions. These older populations may have some residual caution about resuming travel after the pandemic.
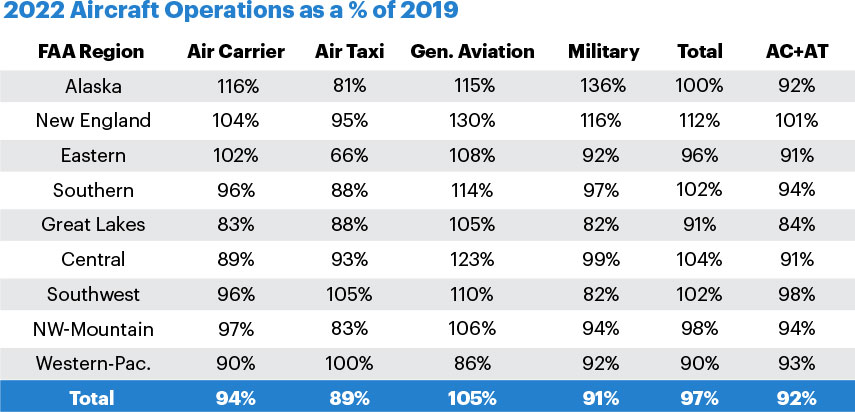
Commercial aircraft (FAA Air Carrier and Air Taxi) operation volumes did not closely align with changes in passenger demand. Great Lakes and Eastern Region aircraft operations counts declined comparably to passenger volume losses. Southern and Southwest Regions had only small losses in aircraft operations. On the other hand, the New England Region saw increased aircraft activity despite having 6% fewer passengers. The Eastern Region had a large decline in Air Taxi Operations while the Southwest Region had an increase and Western Pacific Regions stayed even with the 2019 passenger numbers. American Airlines has shifted a sizable portion of its small aircraft fleet out of the Northeast (PHL Hub) to the Southwest (DFW Hub) and Western-Pacific (PHX Hub) Regions, where distances are longer between airports and fewer options exist to consolidate air service. General aviation activity has sharply increased overall except for the Western-Pacific Region.
Figure 2 – FAA Administrative Regions
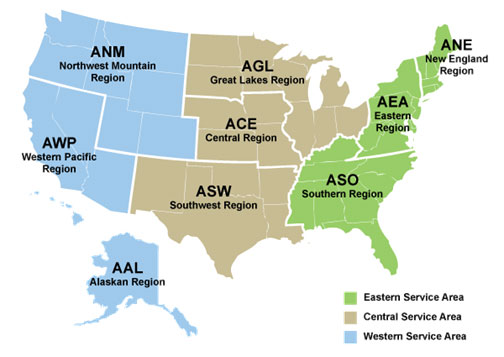
Table 3 – Monthly TSA Checkpoint Throughput
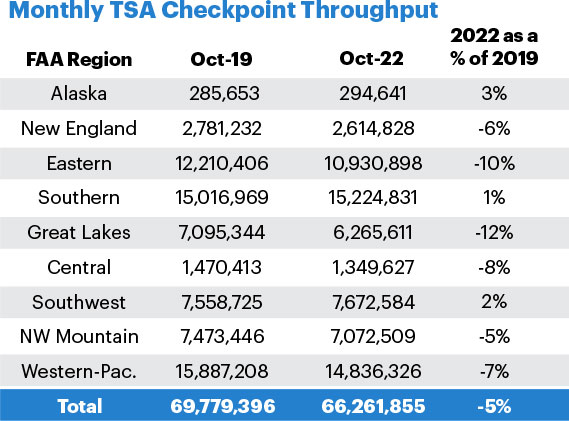
Table 4 – Percent Change in Total Aircraft Operations
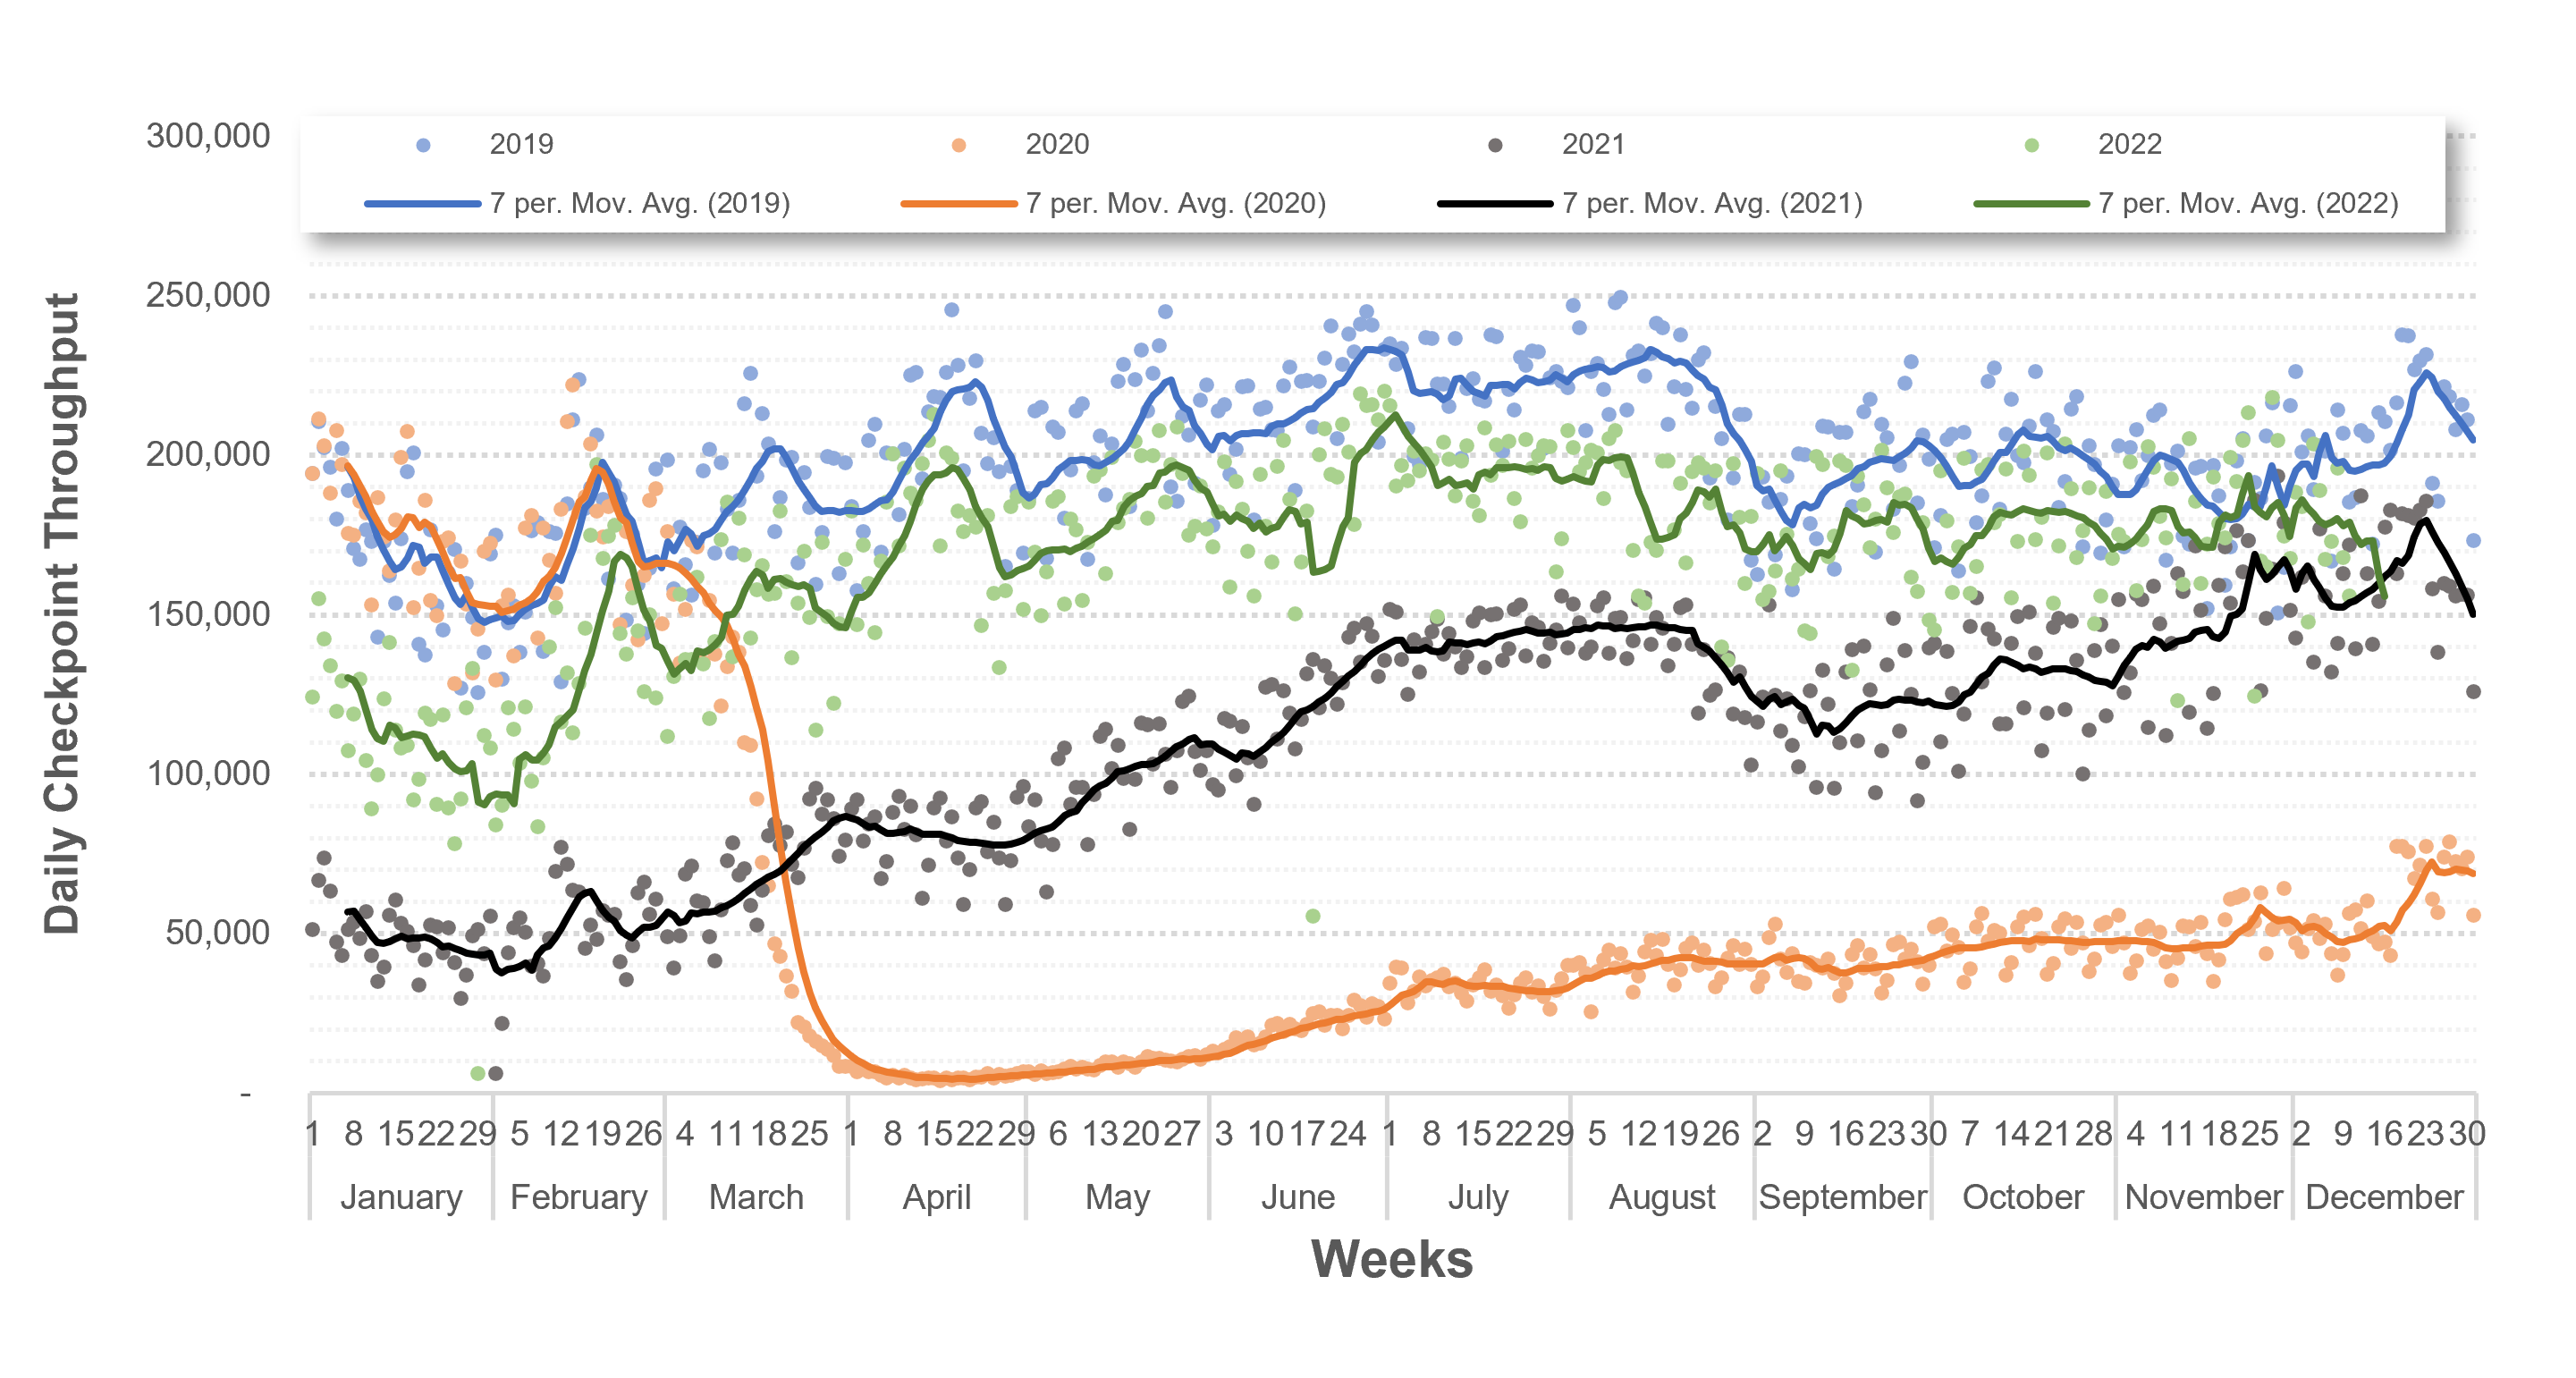
Despite the loss of passengers from Eastern Region airports, Air Carrier operations are above 2019 levels. A substantial portion of this difference is driven by the three large-hub airports serving the New York/New Jersey Region. Daily aircraft operation counts at EWR, LGA and JFK airports have closed in on 2019 volumes. However, TSA Checkpoint counts at these airports remain 7-10 percent below 2019 volumes. While the FAA initially suspended the slot rules at these three airports for the summer season of 2020, it reinstated the rules for the winter season of 2021-2022. As a result, the airlines increased service to these airports in November 2021. The holiday season travel for the New York/New Jersey Region should approach or exceed 2019 levels.
Figure 3 – Combined Daily Aircraft Operations at EWR, LGA and JFK from 2019 to 2022
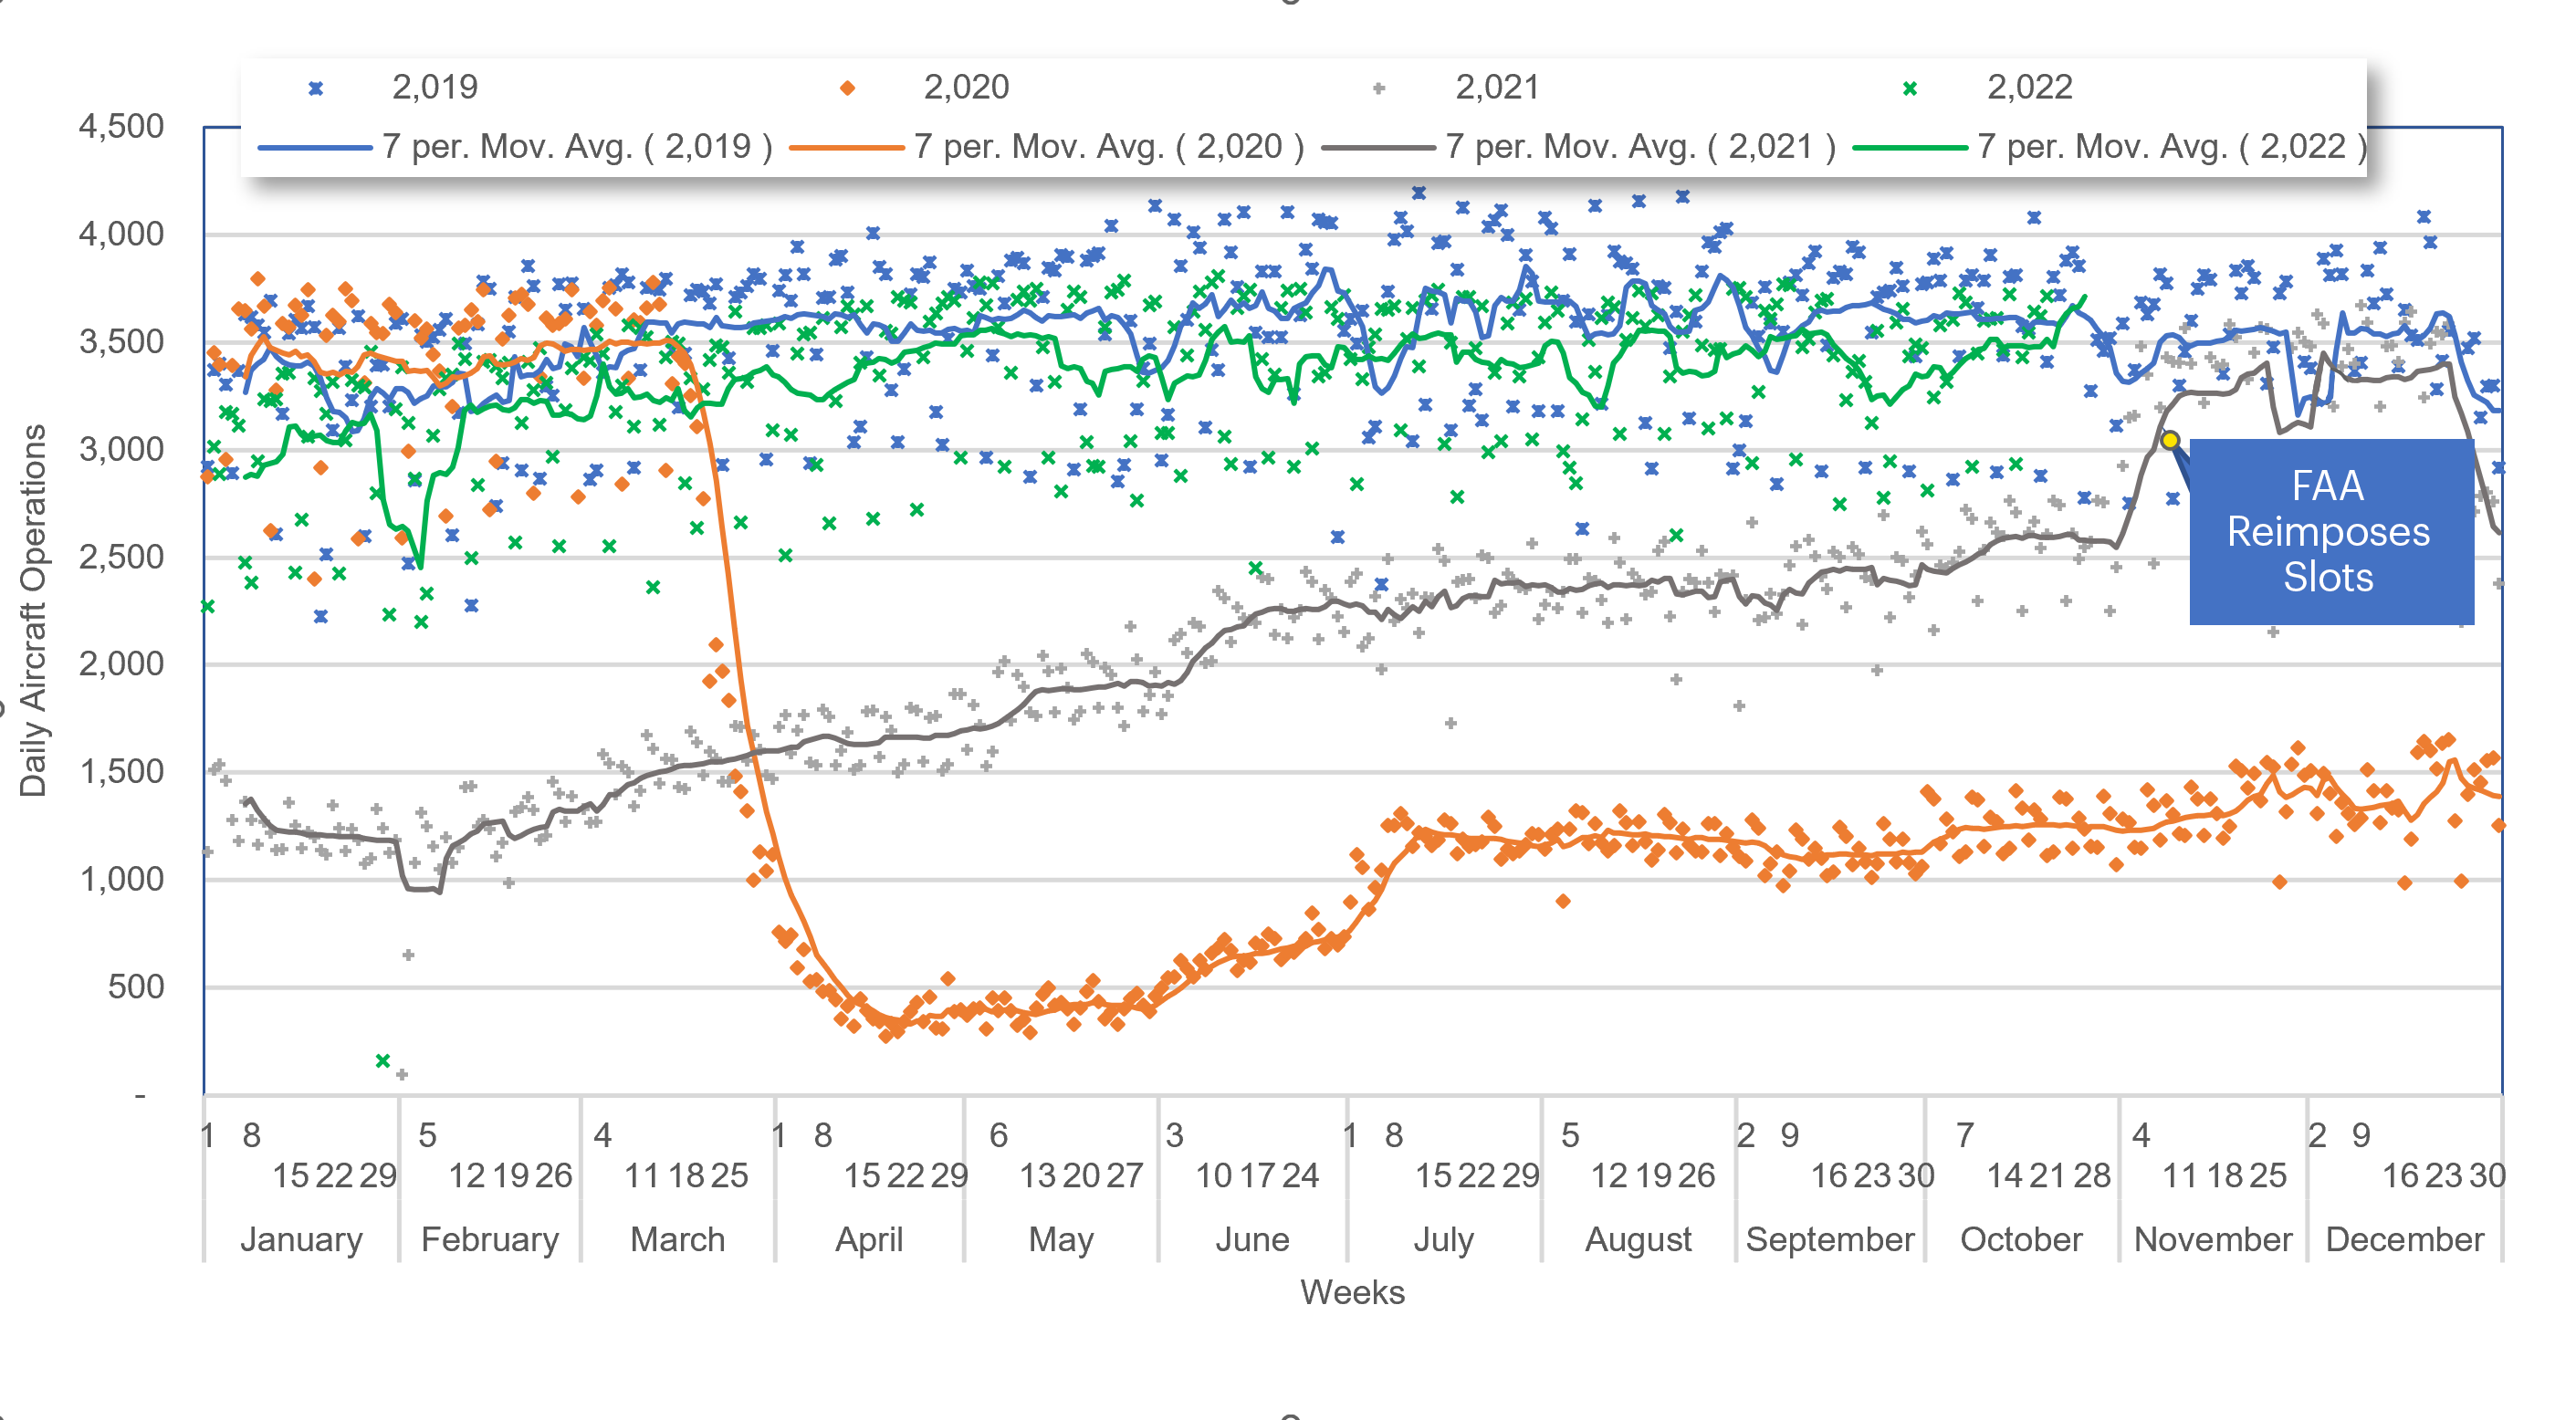
Figure 4 – Daily TSA Checkpoint Counts at EWR, LGA and JFK from 2019 to 2022
Chinese COVID Restrictions Slow Recovery of West Coast Gateways
The largest travel losses occurred at Los Angeles (LAX) and San Francisco (SFO), where Greater China (China, Hong Kong and Taiwan) and Japan travel volumes had been the highest with the highest percentages of international travel. Passenger volumes are also down because fewer passengers connect to the international departures from these two airports.
San Diego has almost fully recovered its 2019 travel volumes reflecting the domestic nature of its air travel market. In general, interior California, Oregon and Washington airports have had a stronger recovery than the large-hub coastal gateways.
Figure 5 – Monthly Travel from West Coast Large Hub Airports

Other Notable Trends Observed in 2022
The airlines have made public statements about how travel has started returning to pre-pandemic volumes highlighting some notable changes. First, business travel has substantially recovered but has not fully returned to 2019 levels. Second, working from home has led to more combined leisure and business travel, where travelers extend their trips to include days before or after a business meeting. “Work from home” has evolved to “work from anywhere,” so long as one can connect to business networks. Airlines have noted two benefits of working from anywhere. First, it has reduced the seasonal drop-off in demand from summer into fall as some passengers postponed August vacations to September. Second, it has led to more travel on previously light travel days, as passengers extend their trips to Saturday, Tuesday or even Wednesday.
Short-Term Outlook
The first and second quarters of 2023 should resemble a continuation of trends observed in the third and fourth quarters of 2022. Strong leisure demand will continue to drive total demand. January and February will show their usual weakness in demand. Look for a strong spring break travel surge, followed by a good summer season.
The recovery of business travel will continue but likely at a slower pace due to businesses reducing costs in anticipation of a recession in 2023. While employment remains high, some sectors (such as housing) are showing slowdowns due to interest rates and other cost increases. Rates of inflation appear to have peaked but will remain higher than those observed in the run-up to the pandemic. Higher prices will likely reduce demand and as a result may reduce business revenues.
Airline pilot shortages will persist thus giving current airline networks an air of permanence. Small-hub and non-hub cities will struggle to regain the diversity and frequency of air service they previously had. The large airline connecting hubs, such as Dallas-Ft. Worth (DFW), Chicago O’Hare (ORD) and Atlanta (ATL) will continue to have fewer flights in 2023 than they had in 2019.
Working from home will lead to fewer but longer trips as passengers continue combining vacation trips with work trips. Such habits will benefit business travel to vacation destinations such as south Florida, Denver, and New York, but will likely not benefit business travel to destinations such as Houston, Detroit, and Atlanta. Airlines will continue to benefit from the spreading of demand from peak seasons to shoulder seasons and peak weekdays to non-peak days.
The earliest return of trans-Pacific travel is expected to be in the 2nd or 3rd Quarter of 2023. While many forecasters expected the Chinese government to end their zero-COVID policy after the Communist Party Congress of October 2022, the Chinese have chosen only to relax their prior policies. These relaxations focused on travel within China and enabling quarantining at home. Foreign travel restrictions remained largely unchanged. Foreign travel restrictions should eventually ease as their vaccination (with booster shots) rates continue to increase and they gain more experience in their new procedures for managing COVID outbreaks. When that happens, expect a strong surge of leisure-oriented travel to China, especially from the west coast gateways.
Fuel supplies have largely adjusted to the avoidance of using Russian oil. However, supplies remain tight and more vulnerable to changes in availability from remaining suppliers. While prices have moderated from early 2022 highs, they remain vulnerable to short-term increases. Expect air travel prices to remain relatively high during peak travel seasons.
To all our readers, we wish you and your loved ones a Joyous Holiday and a Happy New Year! See you all in 2023!
1 TSA checkpoint volumes typically include five to seven percent non-passengers, a percentage that has remained largely unchanged between 2019 and 2022. This analysis uses TSA checkpoint volumes as a surrogate for passengers, but we acknowledge the marginal overstatement of passenger volumes they represent.
What is the L&B LAB?
The LAB is Landrum & Brown’s research and development unit. Our mission is to harness decades worth of industry knowledge and expertise to develop innovative solutions that support our clients along with promoting industry thought leadership.
This document was prepared by Landrum & Brown, Inc. | [email protected]
Sign up to receive our next L&B LAB in your inbox!

